Figure 7

Pairwise Combination Recall Under a Fixed Top-50 Budget

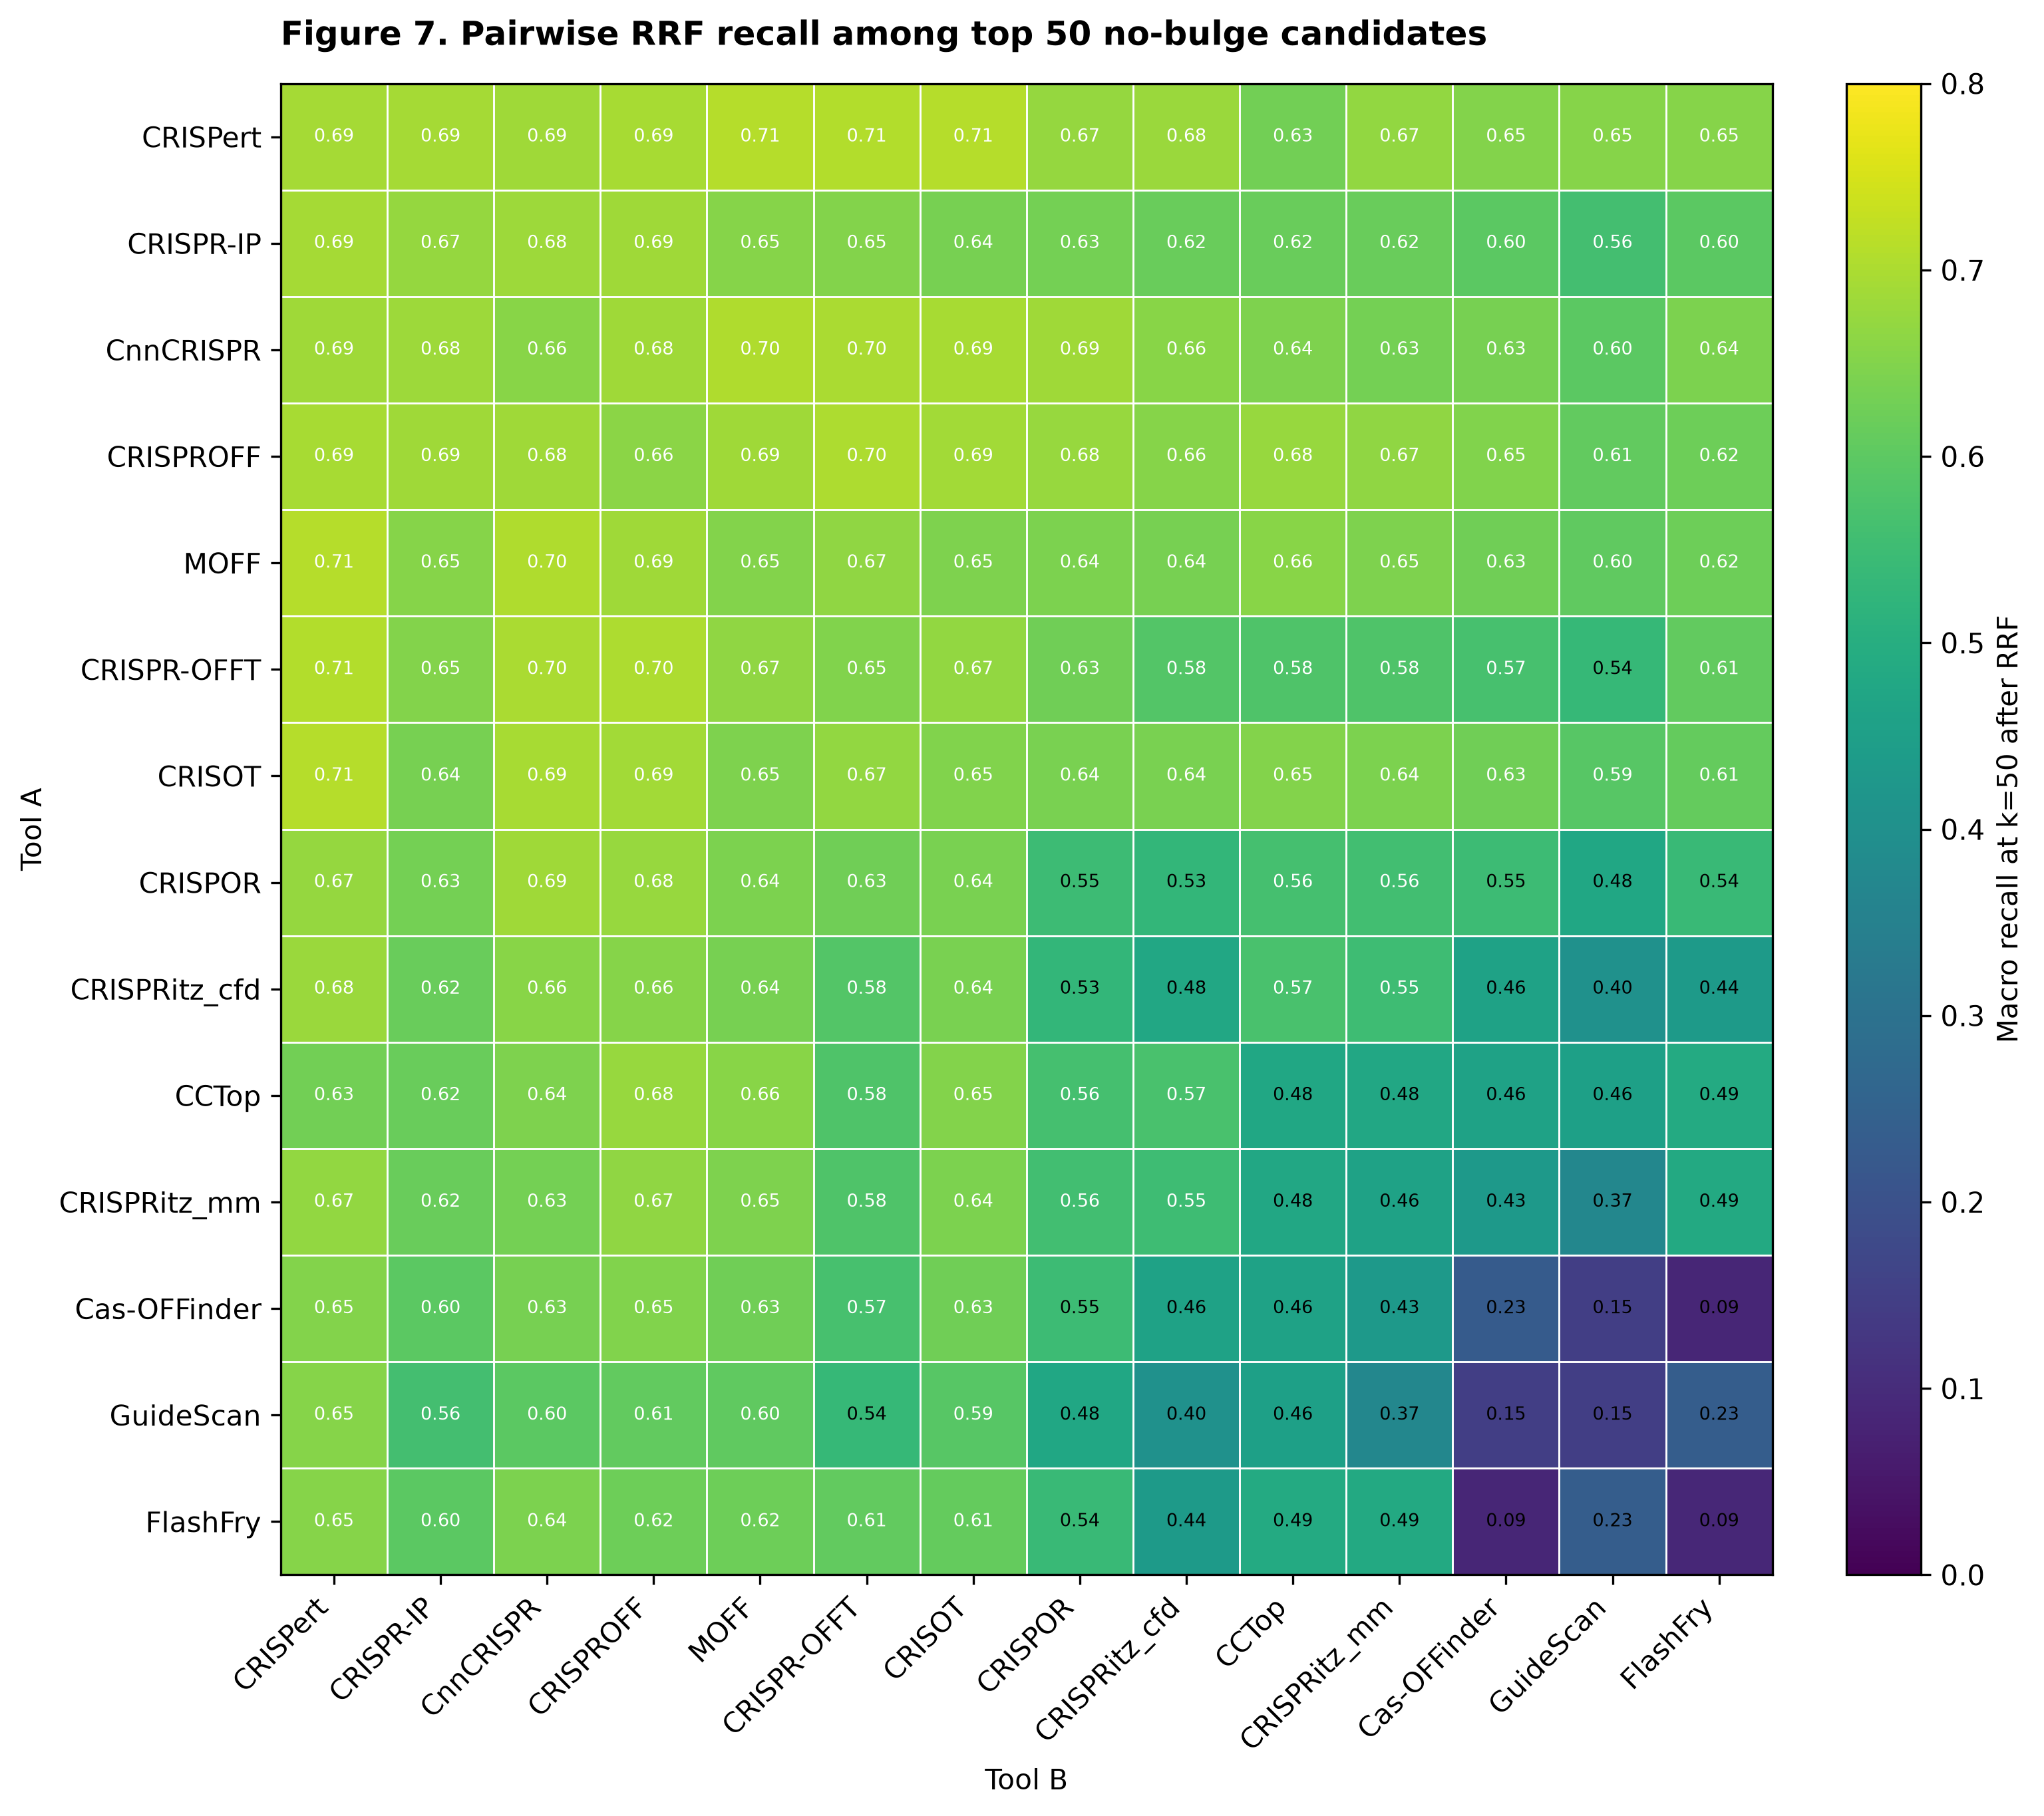
Figure 7 shows the effect of combining prediction tools on recall. Recall of true off-target sites is measured among the top 50 ranked candidates after combining pairs of prediction tools using Reciprocal Rank Fusion. The analysis is restricted to full-length off-target sites without bulges to allow inclusion of ML-based models.

Input

The heatmap uses the no-bulge mixed standard-plus-ML benchmark output:

  • results/benchmark_runs/no_bulge_ml_comparison/benchmark_budget_constrained_pairwise_recall.csv

The table is already in long format, with one row per tool pair and rank cutoff.

Code
import matplotlib.pyplot as plt
import numpy as np
import pandas as pd

from offtarget_benchmark.layout import repo_layout

layout = repo_layout()
figure_dir = layout.docs_dir / "generated_figures"
figure_dir.mkdir(parents=True, exist_ok=True)

pairwise = pd.read_csv(
    layout.results_dir / "benchmark_runs" / "no_bulge_ml_comparison" / "benchmark_budget_constrained_pairwise_recall.csv"
)
pairwise.head(10)
tool_a tool_b k macro_recall micro_recall hits_sum n_truth_true_sum n_guides fusion_method rrf_constant
0 CCTop CCTop 50 0.475297 0.315789 36.0 114.0 22 rrf 60.0
1 CCTop CRISOT 50 0.652234 0.473684 54.0 114.0 22 rrf 60.0
2 CCTop CRISPOR 50 0.562617 0.421053 48.0 114.0 22 rrf 60.0
3 CCTop CRISPR-IP 50 0.617507 0.438596 50.0 114.0 22 rrf 60.0
4 CCTop CRISPR-OFFT 50 0.580198 0.464912 53.0 114.0 22 rrf 60.0
5 CCTop CRISPROFF 50 0.677716 0.438596 50.0 114.0 22 rrf 60.0
6 CCTop CRISPRitz_cfd 50 0.568969 0.429825 49.0 114.0 22 rrf 60.0
7 CCTop CRISPRitz_mismatch 50 0.480347 0.324561 37.0 114.0 22 rrf 60.0
8 CCTop CRISPert 50 0.629131 0.491228 56.0 114.0 22 rrf 60.0
9 CCTop Cas-OFFinder 50 0.462264 0.307018 35.0 114.0 22 rrf 60.0

Select Top-50 Reciprocal-Rank-Fusion Results

Code
TOOL_ORDER = [
    "CRISPert",
    "CRISPR-IP",
    "CnnCRISPR",
    "CRISPROFF",
    "MOFF",
    "CRISPR-OFFT",
    "CRISOT",
    "CRISPOR",
    "CRISPRitz_cfd",
    "CCTop",
    "CRISPRitz_mismatch",
    "Cas-OFFinder",
    "GuideScan2",
    "FlashFry",
]
TOOL_LABELS = {
    "CRISPRitz_mismatch": "CRISPRitz_mm",
    "Cas-OFFinder": "Cas-OFFinder",
    "GuideScan2": "GuideScan",
}

plot_df = pairwise[pairwise["k"].astype(int) == 50].copy()
plot_df = plot_df[plot_df["tool_a"].isin(TOOL_ORDER) & plot_df["tool_b"].isin(TOOL_ORDER)]
matrix = (
    plot_df.pivot_table(index="tool_a", columns="tool_b", values="macro_recall", aggfunc="mean")
    .reindex(index=TOOL_ORDER, columns=TOOL_ORDER)
)
matrix.iloc[:6, :6]
tool_b CRISPert CRISPR-IP CnnCRISPR CRISPROFF MOFF CRISPR-OFFT
tool_a
CRISPert 0.691305 0.692647 0.685950 0.694126 0.710228 0.708316
CRISPR-IP 0.692647 0.673102 0.683504 0.685724 0.653148 0.651633
CnnCRISPR 0.685950 0.683504 0.656644 0.684674 0.704872 0.697658
CRISPROFF 0.694126 0.685724 0.684674 0.661650 0.685327 0.702046
MOFF 0.710228 0.653148 0.704872 0.685327 0.652495 0.667338
CRISPR-OFFT 0.708316 0.651633 0.697658 0.702046 0.667338 0.649068

The matrix follows the manuscript display order used for the mixed no-bulge comparison. Each cell is the macro recall for the top 50 fused candidates for that pair.

Render the Figure

Code
fig, ax = plt.subplots(figsize=(10.8, 9.2))
im = ax.imshow(matrix.to_numpy(dtype=float), cmap="viridis", vmin=0.0, vmax=0.8)
ax.set_xticks(np.arange(len(TOOL_ORDER)))
ax.set_yticks(np.arange(len(TOOL_ORDER)))
ax.set_xticklabels([TOOL_LABELS.get(tool, tool) for tool in TOOL_ORDER], rotation=45, ha="right")
ax.set_yticklabels([TOOL_LABELS.get(tool, tool) for tool in TOOL_ORDER])
ax.set_title("Figure 7. Pairwise RRF recall among top 50 no-bulge candidates", loc="left", fontweight="bold", pad=14)
ax.set_xlabel("Tool B")
ax.set_ylabel("Tool A")
ax.set_xticks(np.arange(-0.5, len(TOOL_ORDER), 1), minor=True)
ax.set_yticks(np.arange(-0.5, len(TOOL_ORDER), 1), minor=True)
ax.grid(which="minor", color="white", linewidth=0.7)
ax.tick_params(which="minor", bottom=False, left=False)

arr = matrix.to_numpy(dtype=float)
for i in range(arr.shape[0]):
    for j in range(arr.shape[1]):
        value = arr[i, j]
        if np.isfinite(value):
            ax.text(j, i, f"{value:.2f}", ha="center", va="center", fontsize=6.5, color="white" if value >= 0.55 else "black")


cbar = fig.colorbar(im, ax=ax, fraction=0.046, pad=0.04)
cbar.set_label("Macro recall at k=50 after RRF")
fig.tight_layout()
fig.savefig(figure_dir / "figure_7_rrf_pairwise_recall_top50_no_bulge_ml.pdf", dpi=300, bbox_inches="tight")
fig.savefig(figure_dir / "figure_7_rrf_pairwise_recall_top50_no_bulge_ml.png", dpi=300, bbox_inches="tight")
plt.close(fig)