Figure 4

Overview

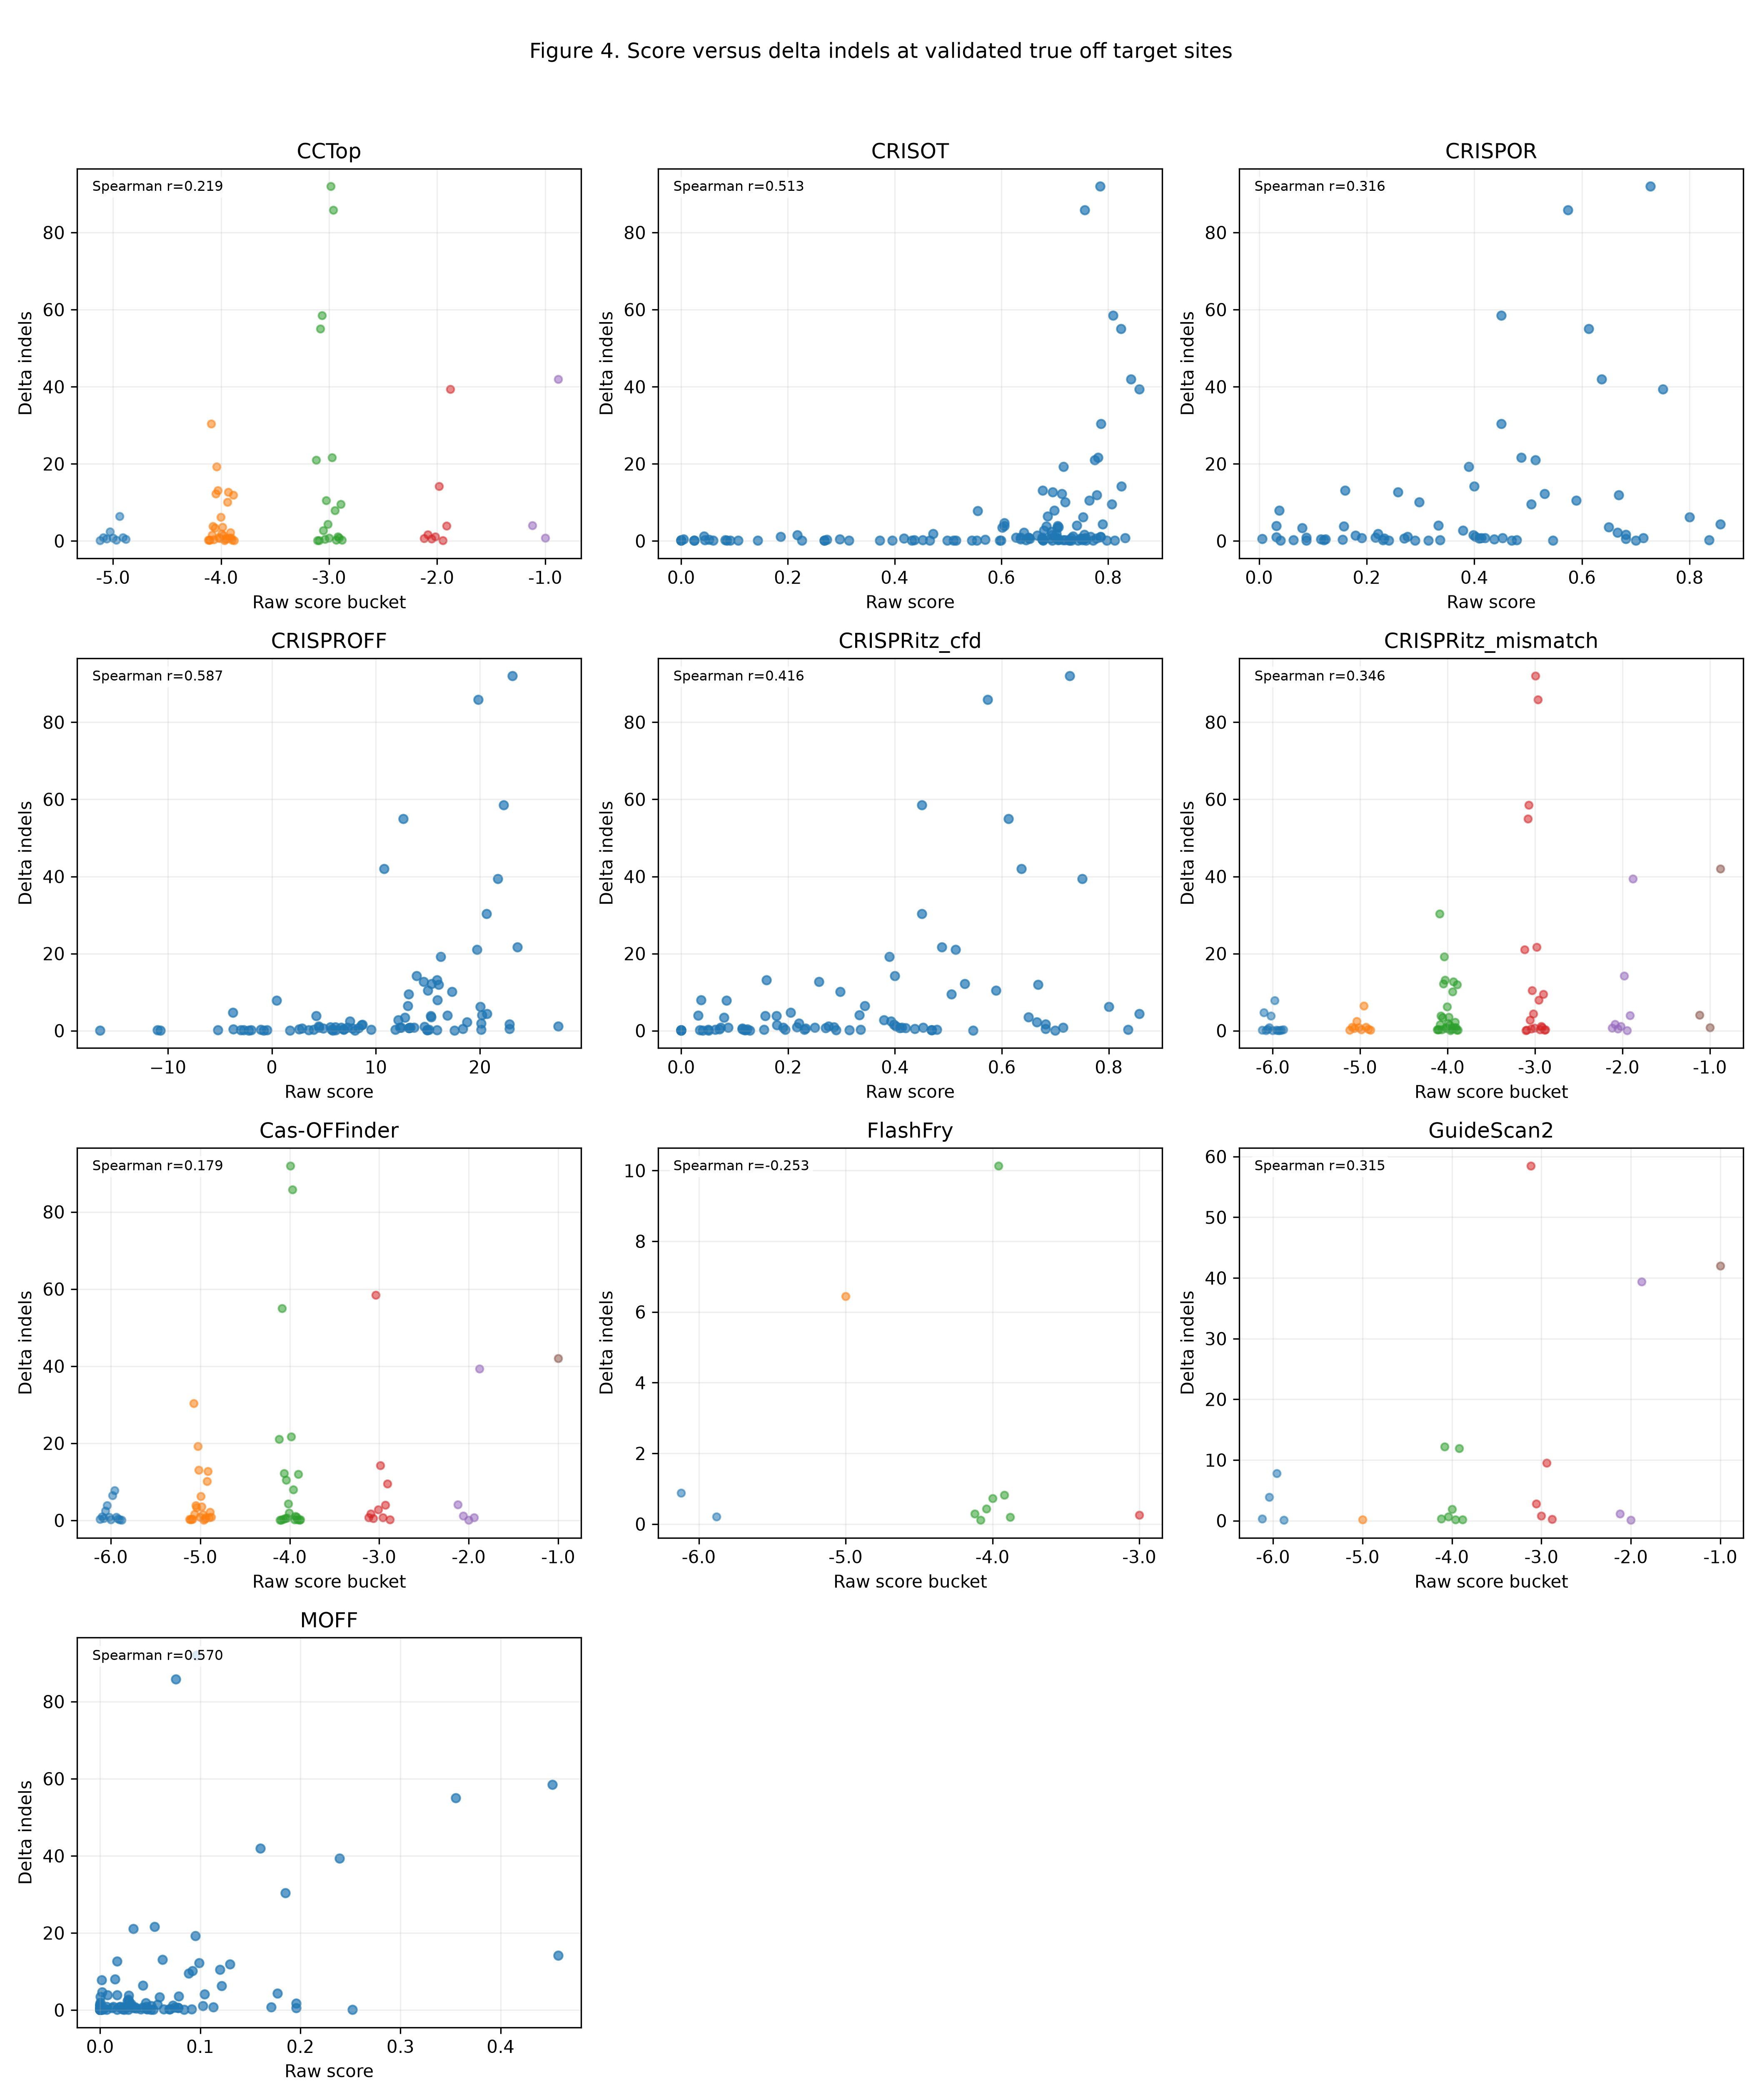
Figure 4 compares tool score with observed editing signal at validated true off target sites.

Input table

  • benchmark_matched_truth_long.csv
Code
from pathlib import Path

import matplotlib.pyplot as plt
import numpy as np
import pandas as pd
from IPython.display import Image, display

from offtarget_benchmark.layout import repo_layout

layout = repo_layout()
benchmark_dir = layout.results_dir / 'benchmark_runs' / 'manuscript_primary'
matched_long = pd.read_csv(benchmark_dir / 'benchmark_matched_truth_long.csv', low_memory=False)

matched_long[['tool', 'guide_key', 'offtarget_seq', 'truth_status', 'delta_indels', 'raw_score', 'rank']].head(10)
tool guide_key offtarget_seq truth_status delta_indels raw_score rank
0 Cas-OFFinder AAAGAACATCCAAGGCTGAGCGG AAAGAACATCCTAGGCTGAGTGG True 4.08 -2.0 48
1 Cas-OFFinder AAAGAACATCCAAGGCTGAGCGG GTTGAACATCCAAGGCTGAGAGG True 21.05 -4.0 51
2 Cas-OFFinder AATCTACATTATATTGCCCCTGG CCCCTACATTAAATTGCCCCAGG False 0.00 -5.0 130
3 Cas-OFFinder AATCTACATTATATTGCCCCTGG TGTCTACAATATATAGTCCCTGG False 0.00 -5.0 130
4 Cas-OFFinder AATCTACATTATATTGCCCCTGG TTTCTACACAATATTGCCCCAGG False 0.00 -5.0 130
5 Cas-OFFinder ACCCACCAAATAGAACCCCCAGG ACTCTTTAAATAGAACTCCCAGG False -0.02 -5.0 121
6 Cas-OFFinder ACCCACCAAATAGAACCCCCAGG CTGTACCAAATAGAACCTCCGGG False 0.00 -6.0 684
7 Cas-OFFinder ACCCACCAAATAGAACCCCCAGG GTTCTATAAATAGAACCCCCAGG False 0.00 -6.0 684
8 Cas-OFFinder ACCCACCAAATAGAACCCCCAGG TATTCCCAAATAGAACCCCCAGG False -0.06 -5.0 121
9 Cas-OFFinder ACTTTGCTGCCACAATACCTTGG ACTTCACTGCCATAATACCTGGG True 0.10 -4.0 53

Truth labels and score classes

Code
DISCRETE_TOOLS = {'Cas-OFFinder', 'GuideScan2', 'CCTop', 'FlashFry', 'CRISPRitz_mismatch'}

def normalize_truth_status(value):
    if pd.isna(value):
        return 'unknown'
    if isinstance(value, (bool, np.bool_)):
        return 'true' if bool(value) else 'false'
    text = str(value).strip().lower()
    if text in {'true', 'off'}:
        return 'true'
    if text in {'false', 'on'}:
        return 'false'
    return 'unknown'

figure4_df = matched_long.copy()
figure4_df['truth_status'] = figure4_df['truth_status'].map(normalize_truth_status)
figure4_df['is_self_match'] = (
    figure4_df['guide_key'].astype('string').eq(figure4_df['offtarget_seq'].astype('string'))
    & figure4_df['guide_key'].notna()
    & figure4_df['offtarget_seq'].notna()
)
figure4_df['score_class'] = figure4_df['tool'].astype(str).map(
    lambda tool: 'coarse_ordinal' if tool in DISCRETE_TOOLS else 'continuous_site_level'
)
figure4_df[['tool', 'truth_status', 'raw_score', 'delta_indels', 'score_class']].head(10)
tool truth_status raw_score delta_indels score_class
0 Cas-OFFinder true -2.0 4.08 coarse_ordinal
1 Cas-OFFinder true -4.0 21.05 coarse_ordinal
2 Cas-OFFinder false -5.0 0.00 coarse_ordinal
3 Cas-OFFinder false -5.0 0.00 coarse_ordinal
4 Cas-OFFinder false -5.0 0.00 coarse_ordinal
5 Cas-OFFinder false -5.0 -0.02 coarse_ordinal
6 Cas-OFFinder false -6.0 0.00 coarse_ordinal
7 Cas-OFFinder false -6.0 0.00 coarse_ordinal
8 Cas-OFFinder false -5.0 -0.06 coarse_ordinal
9 Cas-OFFinder true -4.0 0.10 coarse_ordinal

The notebook distinguishes continuous score scales from coarse ordinal score scales before plotting.

Filtered matched rows

Code
figure4_df = figure4_df[
    (figure4_df['truth_status'] == 'true')
    & (~figure4_df['is_self_match'])
    & figure4_df['delta_indels'].notna()
    & figure4_df['raw_score'].notna()
].copy()

figure4_df[['tool', 'guide_key', 'delta_indels', 'raw_score', 'score_class']].head(10)
tool guide_key delta_indels raw_score score_class
0 Cas-OFFinder AAAGAACATCCAAGGCTGAGCGG 4.080 -2.0 coarse_ordinal
1 Cas-OFFinder AAAGAACATCCAAGGCTGAGCGG 21.050 -4.0 coarse_ordinal
9 Cas-OFFinder ACTTTGCTGCCACAATACCTTGG 0.100 -4.0 coarse_ordinal
14 Cas-OFFinder ACTTTGCTGCCACAATACCTTGG 0.143 -4.0 coarse_ordinal
32 Cas-OFFinder ATAGGAGAAGATGATGTATAGGG 0.736 -3.0 coarse_ordinal
38 Cas-OFFinder ATAGGAGAAGATGATGTATAGGG 0.266 -5.0 coarse_ordinal
45 Cas-OFFinder ATAGGAGAAGATGATGTATAGGG 0.182 -5.0 coarse_ordinal
57 Cas-OFFinder CATACAGGGCTCTGTACCCAGGG 0.292 -5.0 coarse_ordinal
62 Cas-OFFinder CCCTGGCTACCTCCCCTACCCGG 1.704 -3.0 coarse_ordinal
63 Cas-OFFinder CCCTGGCTACCTCCCCTACCCGG 0.547 -3.0 coarse_ordinal

Rows are restricted to validated true off target sites with numeric score and numeric delta_indels. Self matches are removed.

Correlation helper

Code
def spearman_no_scipy(x: pd.Series, y: pd.Series) -> float:
    paired = pd.DataFrame({'x': pd.to_numeric(x, errors='coerce'), 'y': pd.to_numeric(y, errors='coerce')}).dropna()
    if len(paired) < 2 or paired['x'].nunique() < 2 or paired['y'].nunique() < 2:
        return np.nan
    xr = paired['x'].rank(method='average')
    yr = paired['y'].rank(method='average')
    return float(xr.corr(yr, method='pearson'))

The figure annotates each panel with a Spearman correlation computed directly from the plotted values.

Figure generation

Code
figure_dir = layout.docs_dir / 'generated_figures'
figure_dir.mkdir(parents=True, exist_ok=True)

tool_list = sorted(figure4_df['tool'].dropna().astype(str).unique().tolist())
n_cols = 3
n_rows = int(np.ceil(len(tool_list) / n_cols))
fig, axes = plt.subplots(n_rows, n_cols, figsize=(4.7 * n_cols, 4.2 * n_rows), squeeze=False)
flat_axes = axes.ravel()

for idx, tool in enumerate(tool_list):
    ax = flat_axes[idx]
    sub = figure4_df[figure4_df['tool'] == tool].copy()
    plot_df = pd.DataFrame({
        'raw_score': pd.to_numeric(sub['raw_score'], errors='coerce'),
        'delta_indels': pd.to_numeric(sub['delta_indels'], errors='coerce'),
    }).dropna()

    if sub['score_class'].iloc[0] == 'continuous_site_level':
        ax.scatter(plot_df['raw_score'], plot_df['delta_indels'], alpha=0.7, s=24)
        ax.set_xlabel('Raw score')
    else:
        buckets = sorted(plot_df['raw_score'].dropna().astype(float).unique().tolist())
        for pos, bucket in enumerate(buckets, start=1):
            values = plot_df.loc[plot_df['raw_score'] == bucket, 'delta_indels'].to_numpy()
            jitter = np.linspace(-0.12, 0.12, num=len(values)) if len(values) > 1 else np.zeros(len(values))
            ax.scatter(np.full(len(values), pos) + jitter, values, s=18, alpha=0.55)
        ax.set_xticks(range(1, len(buckets) + 1))
        ax.set_xticklabels([str(bucket) for bucket in buckets])
        ax.set_xlabel('Raw score bucket')

    rho = spearman_no_scipy(sub['raw_score'], sub['delta_indels'])
    ax.text(
        0.03,
        0.97,
        f"Spearman r={rho:.3f}" if pd.notna(rho) else 'Spearman r=n/a',
        transform=ax.transAxes,
        ha='left',
        va='top',
        fontsize=8,
        bbox={'boxstyle': 'round,pad=0.25', 'facecolor': 'white', 'alpha': 0.8, 'edgecolor': 'none'},
    )
    ax.set_title(tool)
    ax.set_ylabel('Delta indels')
    ax.grid(alpha=0.2)

for ax in flat_axes[len(tool_list):]:
    ax.set_axis_off()

fig.suptitle('Figure 4. Score versus delta indels at validated true off target sites')
fig.tight_layout(rect=[0, 0, 1, 0.96])
out_path = figure_dir / 'figure_4_score_vs_indels_by_tool.png'
fig.savefig(out_path, dpi=300)
plt.close(fig)

display(Image(filename=str(out_path)))