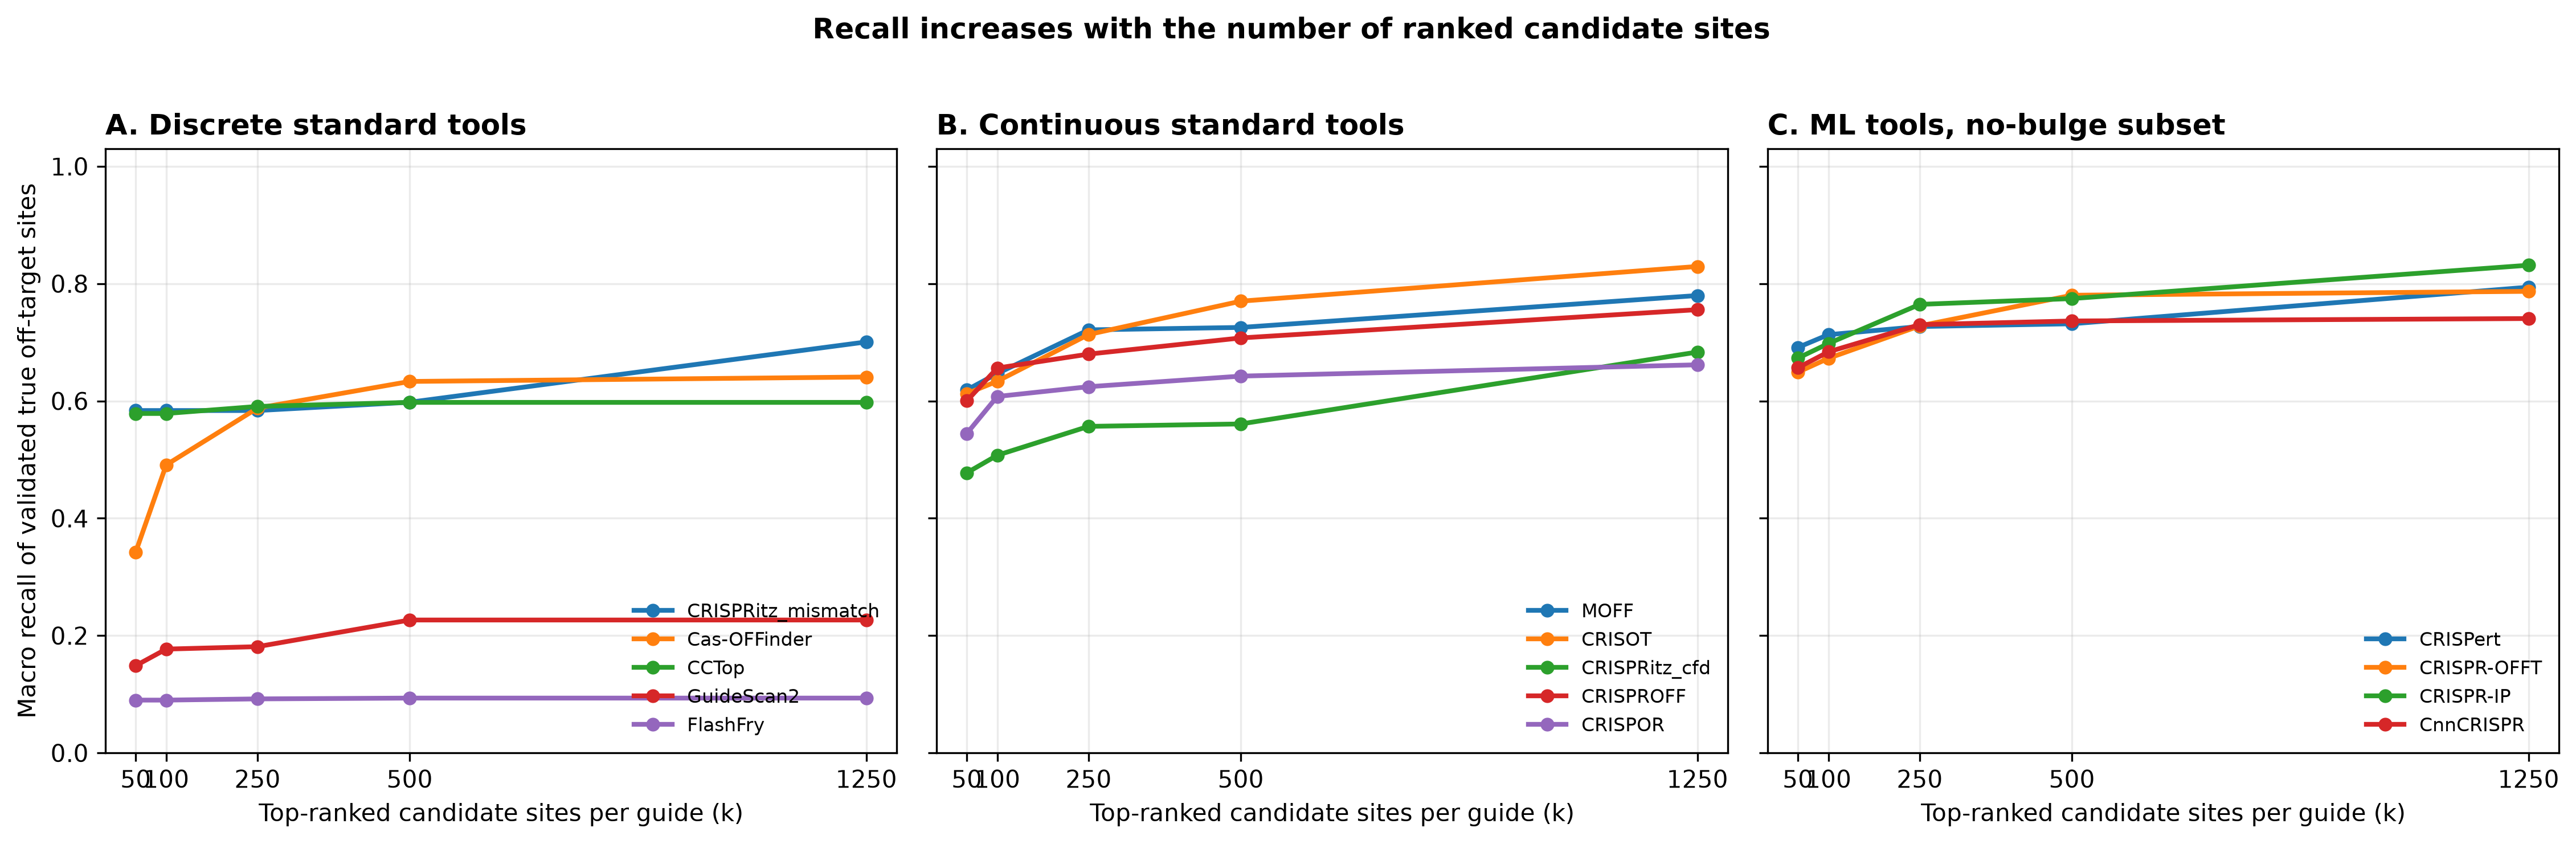
Figure 6 shows recall of validated true off-target sites as the number of ranked candidates per guide increases. The x-axis is the rank cutoff k; the y-axis is macro recall, averaged over guides.
Panels A and B use the full standard-tool manuscript benchmark. Panel C uses the bulge-restricted benchmark prepared for the ML tools.
The standard-tool panels are reconstructed from the wide macro_recall_at_k_* columns in benchmark_overall.csv. The ML panel uses the no-bulge recall-curve table directly.
Code
import matplotlib.pyplot as pltimport numpy as npimport pandas as pdfrom offtarget_benchmark.layout import repo_layoutlayout = repo_layout()figure_dir = layout.docs_dir /"generated_figures"figure_dir.mkdir(parents=True, exist_ok=True)standard_overall = pd.read_csv(layout.results_dir /"benchmark_runs"/"manuscript_primary"/"benchmark_overall.csv")ml_curves = pd.read_csv(layout.results_dir /"benchmark_runs"/"no_bulge_ml_comparison"/"benchmark_overall_recall_curves.csv")K_VALUES = [50, 100, 250, 500, 1250]standard_rows = []for row in standard_overall.itertuples(index=False):for k in K_VALUES: standard_rows.append({"tool_slug": getattr(row, "tool_slug"),"tool": getattr(row, "tool"),"k": k,"macro_recall": getattr(row, f"macro_recall_at_k_{k}"), })standard_curves = pd.DataFrame(standard_rows)ml_curves = ml_curves[ml_curves["k"].isin(K_VALUES)].copy(){"standard_tools": standard_curves["tool"].nunique(),"standard_k_values": sorted(standard_curves["k"].unique().tolist()),"no_bulge_tools": ml_curves["tool"].nunique(),"no_bulge_k_values": sorted(ml_curves["k"].unique().tolist()),}
The first two panels use the standard full-cohort benchmark. The ML panel uses the no-bulge benchmark because those models were evaluated only on compatible full-length off-target sites without bulges.
Define Panels
Code
DISCRETE_STANDARD_TOOLS = ["CRISPRitz_mismatch", "Cas-OFFinder", "CCTop", "GuideScan2", "FlashFry"]CONTINUOUS_STANDARD_TOOLS = ["MOFF", "CRISOT", "CRISPRitz_cfd", "CRISPROFF", "CRISPOR"]ML_TOOLS = ["CRISPert", "CRISPR-OFFT", "CRISPR-IP", "CnnCRISPR"]panels = [ ("A. Discrete standard tools", standard_curves, DISCRETE_STANDARD_TOOLS), ("B. Continuous standard tools", standard_curves, CONTINUOUS_STANDARD_TOOLS), ("C. ML tools, no-bulge subset", ml_curves, ML_TOOLS),]pd.DataFrame( {"panel": [panel for panel, _, _ in panels],"n_tools": [len(tools) for _, _, tools in panels],"tools": [", ".join(tools) for _, _, tools in panels], })
panel
n_tools
tools
0
A. Discrete standard tools
5
CRISPRitz_mismatch, Cas-OFFinder, CCTop, Guide...
1
B. Continuous standard tools
5
MOFF, CRISOT, CRISPRitz_cfd, CRISPROFF, CRISPOR
2
C. ML tools, no-bulge subset
4
CRISPert, CRISPR-OFFT, CRISPR-IP, CnnCRISPR
Render the Figure
Code
tab10 = plt.get_cmap("tab10")fig, axes = plt.subplots(1, 3, figsize=(15.2, 4.8), sharey=True)for ax, (panel, curves, tools) inzip(axes, panels):for idx, tool inenumerate(tools): tool_df = curves[curves["tool"] == tool].copy().sort_values("k") tool_df = tool_df.set_index("k").reindex(K_VALUES).reset_index() ax.plot( K_VALUES, pd.to_numeric(tool_df["macro_recall"], errors="coerce"), marker="o", linewidth=2.0, markersize=4.8, color=tab10(idx %10), label=tool, ) ax.set_title(panel, loc="left", fontweight="bold") ax.set_xlim(0, 1300) ax.set_xticks(K_VALUES) ax.set_xticklabels([str(k) for k in K_VALUES]) ax.set_xlabel("Top-ranked candidate sites per guide (k)") ax.set_ylim(0, 1.03) ax.grid(alpha=0.25) ax.legend(frameon=False, fontsize=8, loc="lower right")axes[0].set_ylabel("Macro recall of validated true off-target sites")fig.suptitle("Recall increases with the number of ranked candidate sites", fontweight="bold", y=1.02)fig.tight_layout()fig.savefig(figure_dir /"figure_6_recall_at_k_standard_and_ml.pdf", dpi=300, bbox_inches="tight")fig.savefig(figure_dir /"figure_6_recall_at_k_standard_and_ml.png", dpi=300, bbox_inches="tight")plt.close(fig)