Figure 1

Overview

Figure 1 summarizes the benchmark cohort. The notebook derives the three figure panels directly from data/manuscript/manuscript_primary.csv, following the same transformations used by the manuscript asset builder.

Input table

  • data/manuscript/manuscript_primary.csv
Code
import matplotlib.pyplot as plt
import numpy as np
import pandas as pd
from IPython.display import Image, display

from offtarget_benchmark.layout import repo_layout

layout = repo_layout()
primary_path = layout.data_dir / 'manuscript' / 'manuscript_primary.csv'
primary = pd.read_csv(primary_path, low_memory=False)

{
    'rows': len(primary),
    'guides': primary['guide_seq'].astype(str).nunique(),
    'truth_status_values': sorted(primary['truth_status'].dropna().astype(str).unique().tolist()),
}
{'rows': 3827, 'guides': 26, 'truth_status_values': ['False', 'True']}

Cohort summaries used for the panels

The manuscript figure is assembled from three summaries of the same primary truth table. The first summary counts how many sequenced candidate sites belong to each guide. This gives the left panel, which shows the uneven sequencing burden across guides rather than treating every guide as if it contributed the same number of tested sites.

The second summary keeps rows with a numeric delta_indels value. This editing measurement is the experimental signal used in the middle panel. Binning the values makes the distribution readable despite the long right tail in editing activity.

The third summary adds mismatch architecture. For each quantified row, the first 20 nucleotides of guide_seq and offtarget_seq are compared as the protospacer, and positions 21-23 are compared as the PAM. These counts are used only for the right panel, which relates observed editing to protospacer mismatch count and marks whether the PAM is perfectly matched.

Code
def normalize_truth_status(value):
    if pd.isna(value):
        return 'unknown'
    if isinstance(value, (bool, np.bool_)):
        return 'true' if bool(value) else 'false'
    text = str(value).strip().lower()
    mapping = {'true': 'true', 'false': 'false', 'unknown': 'unknown', 'off': 'true', 'on': 'false'}
    return mapping.get(text, 'unknown')


def mismatch_counts(guide_seq, off_seq):
    guide = str(guide_seq)
    off = str(off_seq)
    if len(guide) < 23 or len(off) < 23:
        return (pd.NA, pd.NA)
    protospacer = sum(a != b for a, b in zip(guide[:20], off[:20]))
    pam = sum(a != b for a, b in zip(guide[20:23], off[20:23]))
    return protospacer, pam


sites_per_guide = (
    primary.groupby('guide_seq', dropna=False)
    .size()
    .rename('n_sites')
    .reset_index()
    .sort_values(['n_sites', 'guide_seq'], ascending=[False, True])
    .reset_index(drop=True)
)

all_quantified = primary[primary['delta_indels'].notna()].copy()
all_quantified['delta_indels'] = pd.to_numeric(all_quantified['delta_indels'], errors='coerce')
all_quantified = all_quantified[all_quantified['delta_indels'].notna()].copy()

quantified = all_quantified.copy()
quantified['truth_status'] = quantified['truth_status'].map(normalize_truth_status)

mismatch_rows = []
for _, row in all_quantified.iterrows():
    protospacer, pam = mismatch_counts(row['guide_seq'], row['offtarget_seq'])
    mismatch_rows.append({
        'guide_seq': row['guide_seq'],
        'offtarget_seq': row['offtarget_seq'],
        'delta_indels': row['delta_indels'],
        'truth_status': row['truth_status'],
        'protospacer_mismatch_count': protospacer,
        'pam_mismatch_count': pam,
    })
mismatch_df = pd.DataFrame(mismatch_rows)

{
    'guides': len(sites_per_guide),
    'quantified_rows': len(quantified),
    'mismatch_rows': len(mismatch_df),
}
{'guides': 26, 'quantified_rows': 3827, 'mismatch_rows': 3827}

The three objects mirror the tables written by the manuscript asset builder. sites_per_guide has one row per guide and one count column. quantified retains the primary-table rows with measured editing signal. mismatch_df is a compact plotting table with the guide, off-target sequence, editing signal, and the two mismatch counts used to stratify the right panel.

Figure generation

The plotting code uses those summaries without additional filtering. Panel A is a histogram of site counts per guide. Panel B bins delta_indels. Panel C plots delta_indels by protospacer mismatch count and colors each point by whether the PAM has zero mismatches or at least one mismatch.

Code
figure_dir = layout.docs_dir / 'generated_figures'
figure_dir.mkdir(parents=True, exist_ok=True)

fig, axes = plt.subplots(1, 3, figsize=(15.5, 4.8))

site_counts = sites_per_guide['n_sites'].dropna().astype(int).to_numpy()
n_bins = min(20, max(8, int(np.ceil(np.sqrt(len(site_counts)))) * 2)) if len(site_counts) else 8
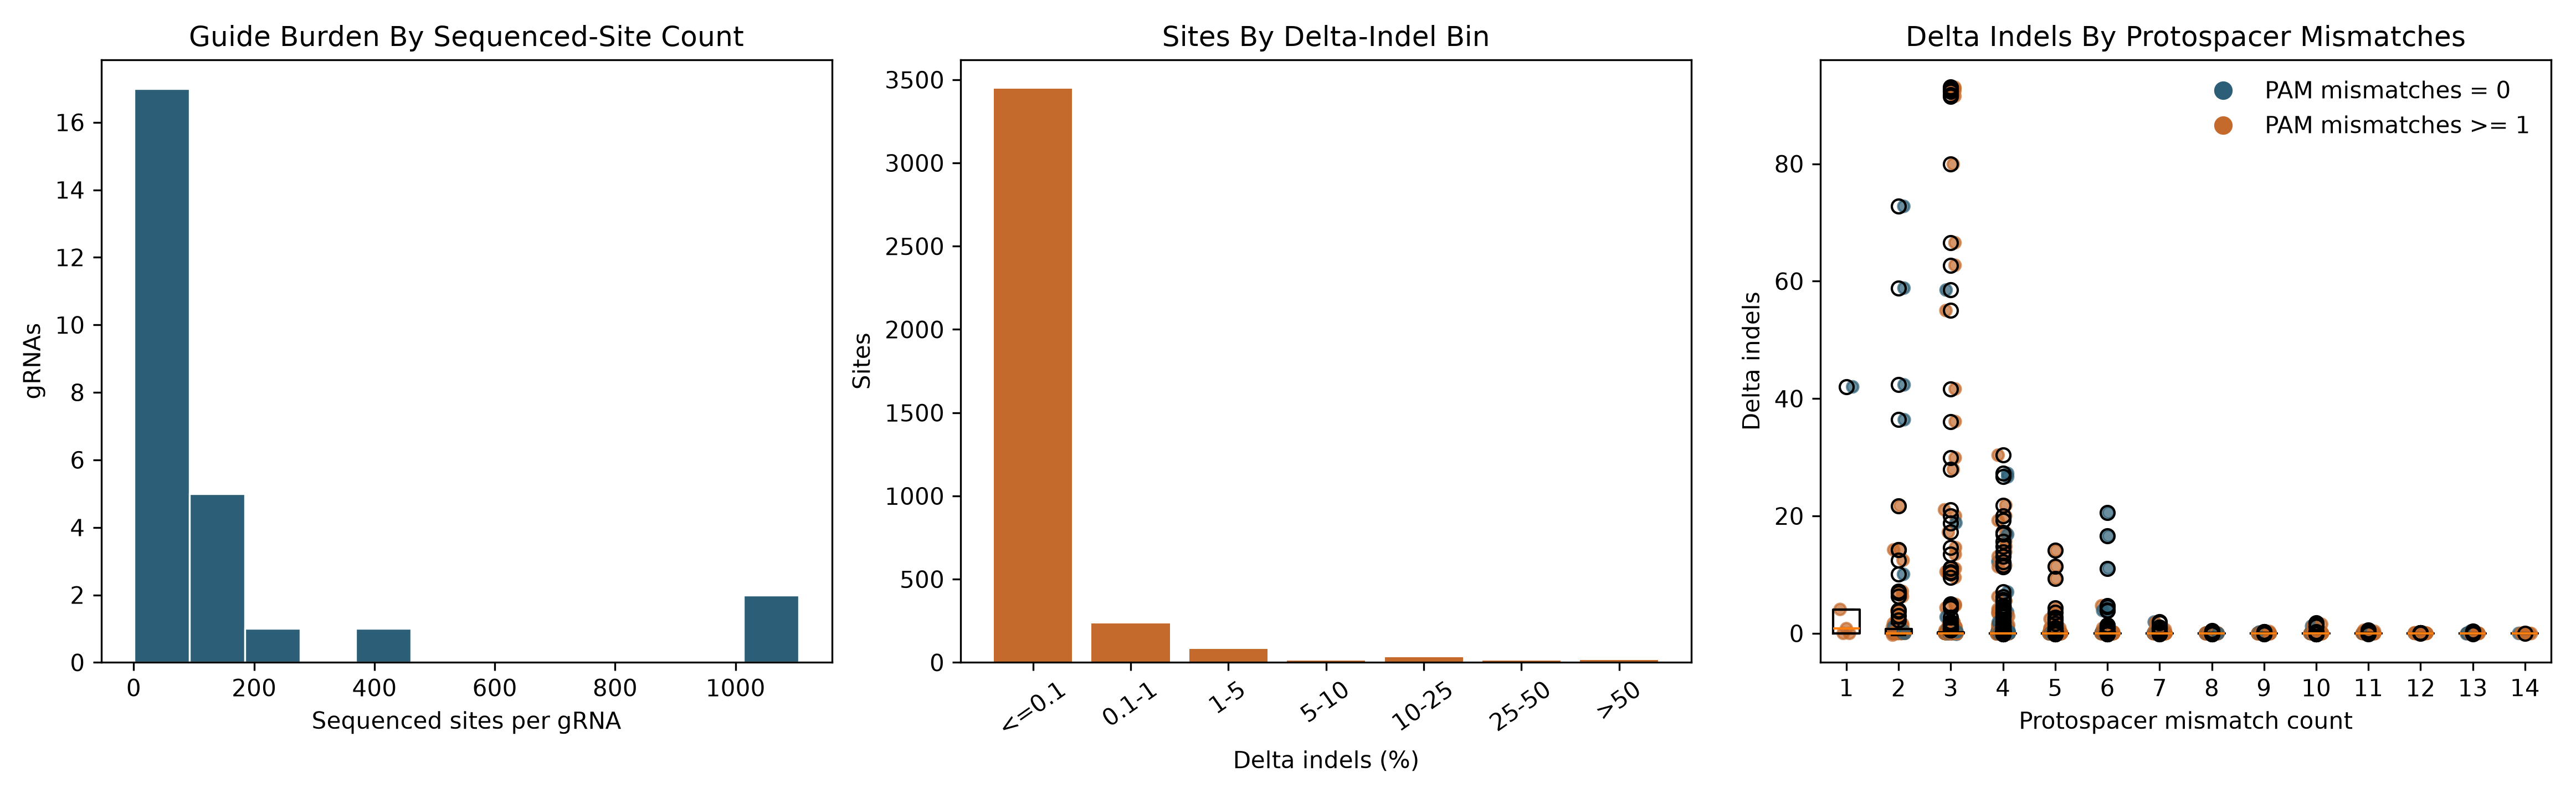
axes[0].hist(site_counts, bins=n_bins, color='#2c5f77', edgecolor='white', linewidth=0.8)
axes[0].set_title('Guide Burden By Sequenced-Site Count')
axes[0].set_xlabel('Sequenced sites per gRNA')
axes[0].set_ylabel('gRNAs')

indel_bins = [-np.inf, 0.1, 1.0, 5.0, 10.0, 25.0, 50.0, np.inf]
indel_labels = ['<=0.1', '0.1-1', '1-5', '5-10', '10-25', '25-50', '>50']
binned = pd.cut(quantified['delta_indels'].astype(float), bins=indel_bins, labels=indel_labels, include_lowest=True)
indel_counts = binned.value_counts(sort=False).reindex(indel_labels, fill_value=0)
axes[1].bar(indel_labels, indel_counts.astype(int), color='#c46a2c', width=0.8)
axes[1].set_title('Sites By Delta-Indel Bin')
axes[1].set_xlabel('Delta indels (%)')
axes[1].set_ylabel('Sites')
axes[1].tick_params(axis='x', rotation=35)

categories = sorted(x for x in mismatch_df['protospacer_mismatch_count'].dropna().unique().tolist())
data = [
    mismatch_df.loc[mismatch_df['protospacer_mismatch_count'] == cat, 'delta_indels'].astype(float).tolist()
    for cat in categories
]
if data:
    from matplotlib.lines import Line2D

    axes[2].boxplot(data, tick_labels=[str(int(cat)) for cat in categories])
    for idx, cat in enumerate(categories, start=1):
        sub = mismatch_df[mismatch_df['protospacer_mismatch_count'] == cat]
        colors = ['#2c5f77' if int(pam) == 0 else '#c46a2c' for pam in sub['pam_mismatch_count'].fillna(0)]
        jitter = np.linspace(-0.12, 0.12, num=len(sub)) if len(sub) else []
        axes[2].scatter(np.full(len(sub), idx) + jitter, sub['delta_indels'], s=24, alpha=0.7, c=colors)
    legend_handles = [
        Line2D([0], [0], marker='o', color='none', markerfacecolor='#2c5f77', markeredgecolor='#2c5f77', markersize=7, label='PAM mismatches = 0'),
        Line2D([0], [0], marker='o', color='none', markerfacecolor='#c46a2c', markeredgecolor='#c46a2c', markersize=7, label='PAM mismatches >= 1'),
    ]
    axes[2].legend(handles=legend_handles, loc='best', frameon=False)
axes[2].set_title('Delta Indels By Protospacer Mismatches')
axes[2].set_xlabel('Protospacer mismatch count')
axes[2].set_ylabel('Delta indels')

fig.tight_layout()
out_path = figure_dir / 'figure_1_dataset_overview.png'
fig.savefig(out_path, dpi=300)
plt.close(fig)

display(Image(filename=str(out_path)))