Figure 3

Overview

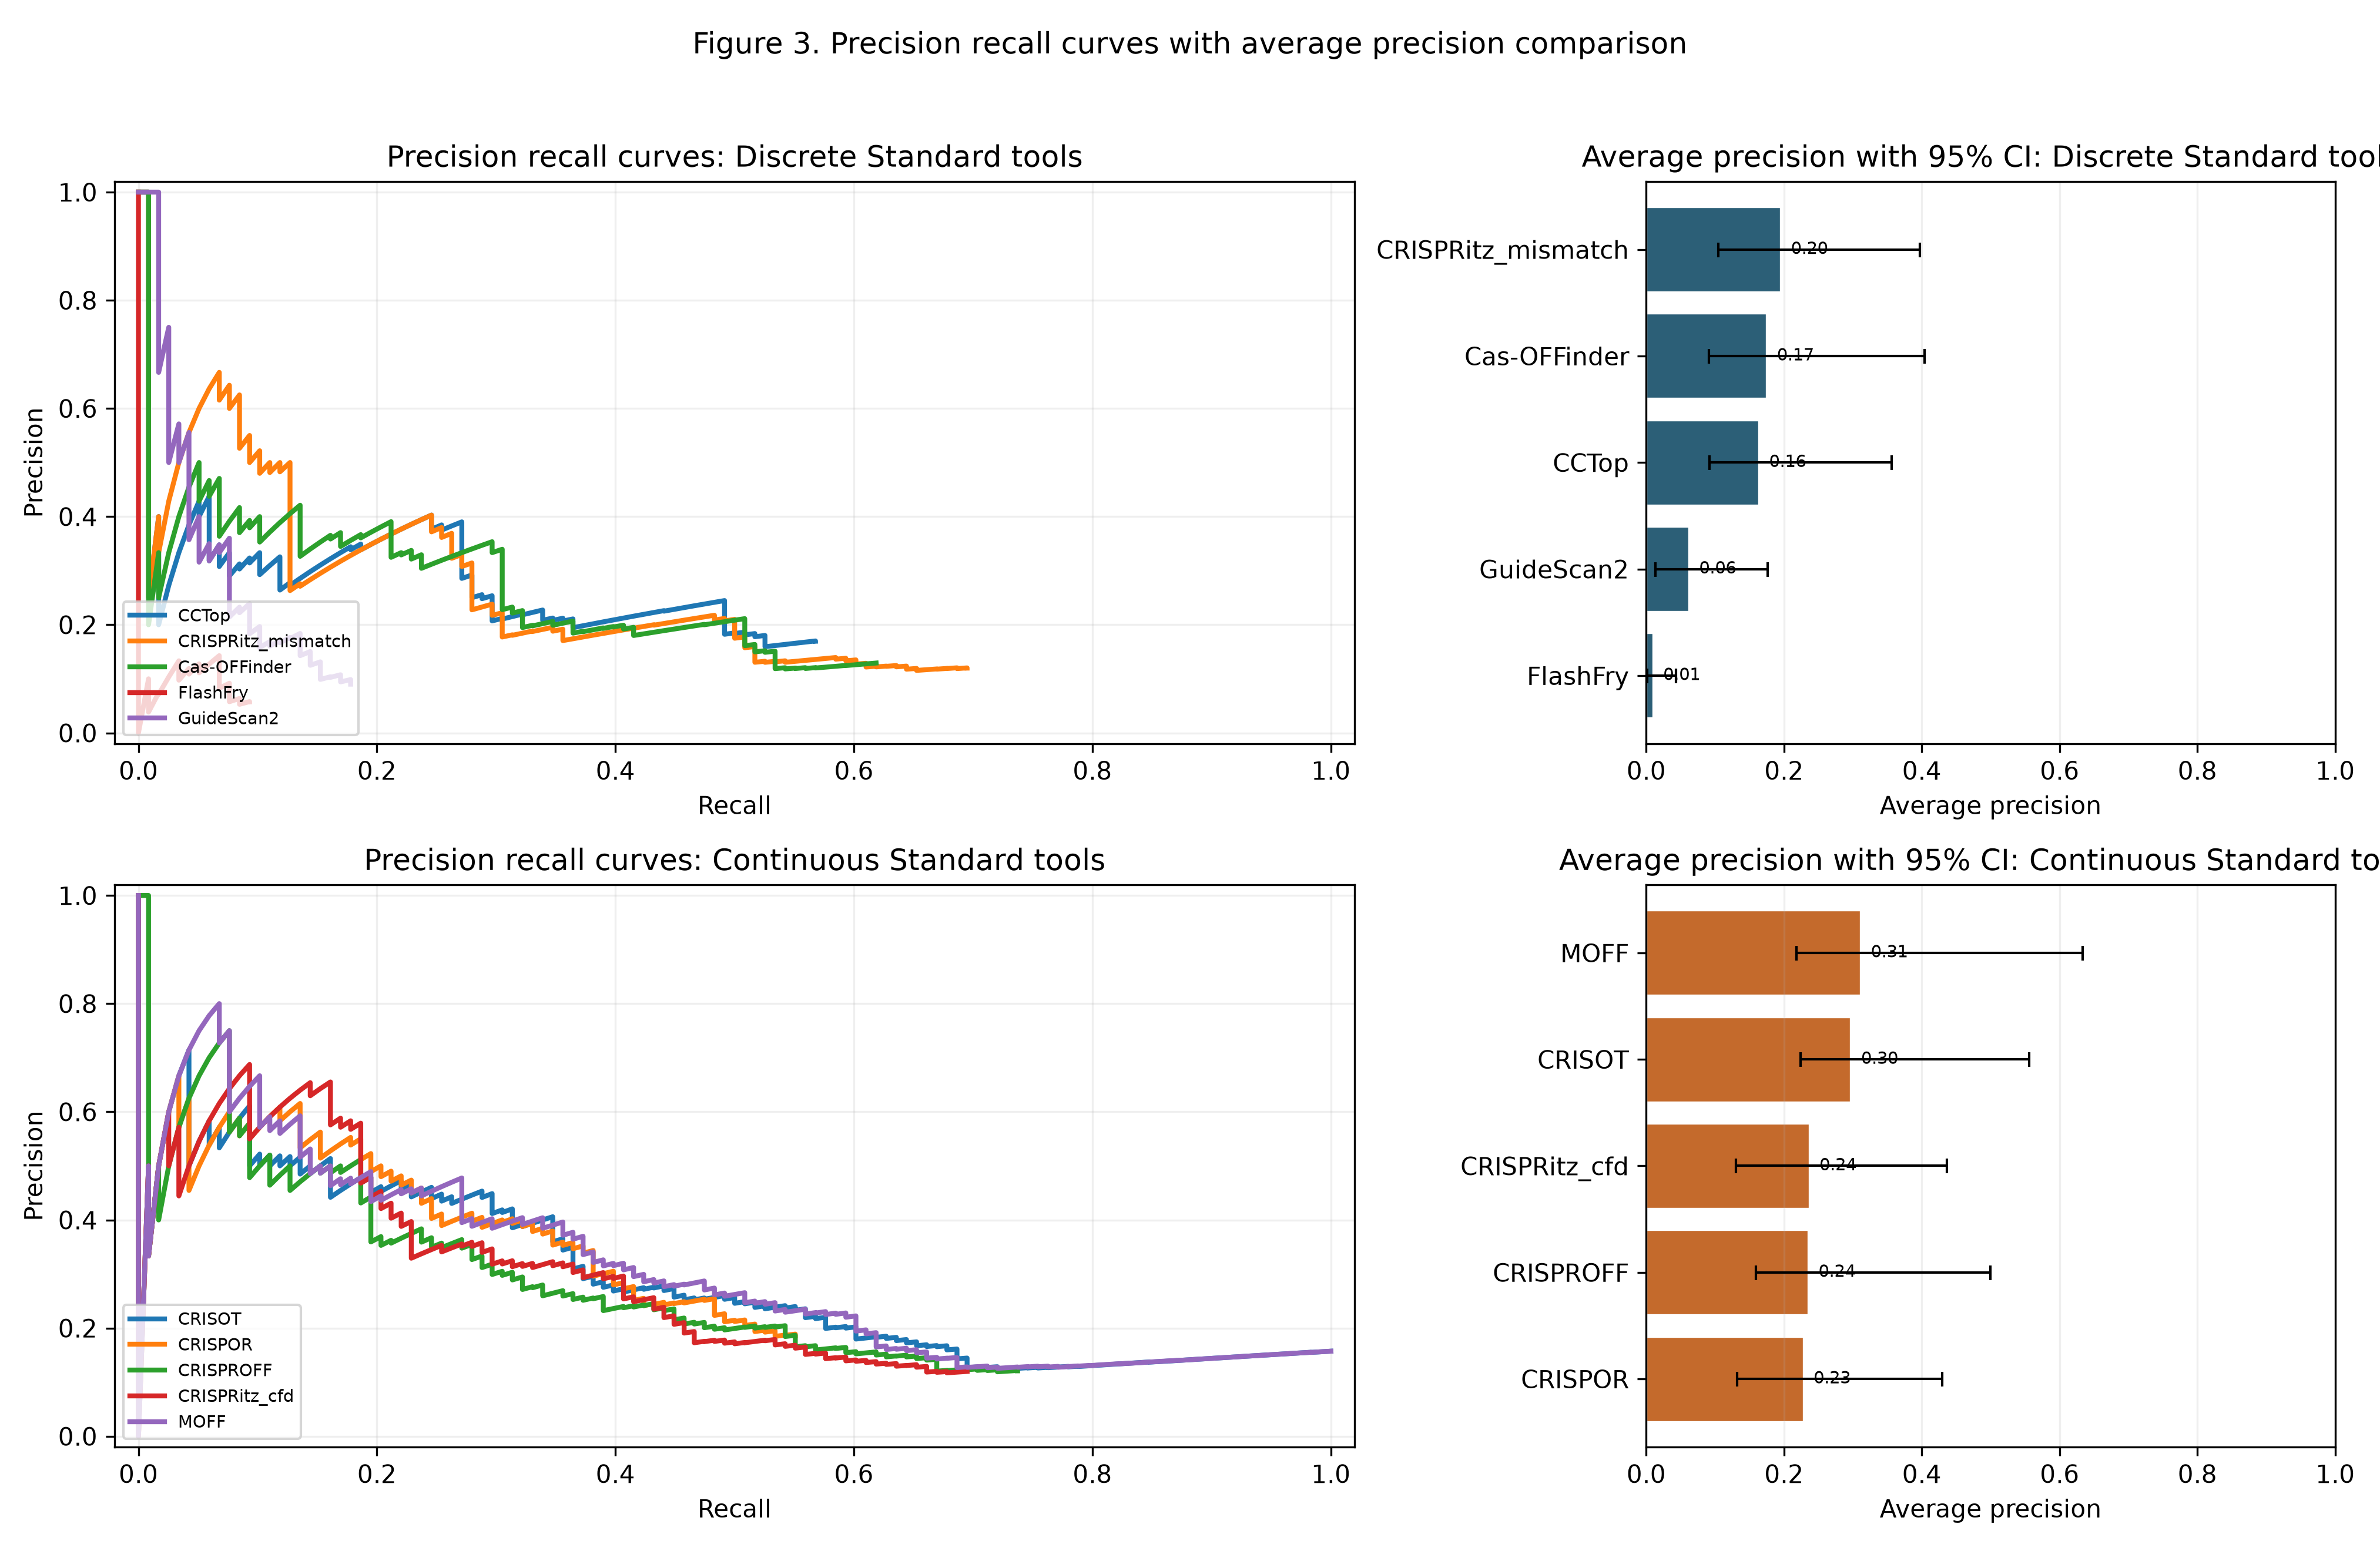
Figure 3 summarizes ranking performance across tools. The left panels show the precision recall curves. The right panels show average precision with guide bootstrap intervals.

Input tables

  • benchmark_pr_curves.csv
  • benchmark_pr_summary.csv
  • benchmark_matched_truth_long.csv
  • benchmark_by_guide.csv
Code
from pathlib import Path

import matplotlib.pyplot as plt
import numpy as np
import pandas as pd
from IPython.display import Image, display

from offtarget_benchmark.layout import repo_layout

layout = repo_layout()
benchmark_dir = layout.results_dir / 'benchmark_runs' / 'manuscript_primary'

pr_curves = pd.read_csv(benchmark_dir / 'benchmark_pr_curves.csv', low_memory=False)
pr_summary = pd.read_csv(benchmark_dir / 'benchmark_pr_summary.csv', low_memory=False)
matched_long = pd.read_csv(benchmark_dir / 'benchmark_matched_truth_long.csv', low_memory=False)
by_guide = pd.read_csv(benchmark_dir / 'benchmark_by_guide.csv', low_memory=False)

{
    'pr_curves_rows': len(pr_curves),
    'pr_summary_rows': len(pr_summary),
    'matched_truth_rows': len(matched_long),
    'by_guide_rows': len(by_guide),
}
{'pr_curves_rows': 5331,
 'pr_summary_rows': 10,
 'matched_truth_rows': 5321,
 'by_guide_rows': 260}

Stored average precision summary

Code
pr_summary[['tool', 'average_precision', 'best_f1', 'n_true_sites']].sort_values(
    'average_precision', ascending=False
).head(10)
tool average_precision best_f1 n_true_sites
9 MOFF 0.311067 0.375000 118
2 CRISOT 0.296917 0.374429 118
4 CRISPRitz_cfd 0.236436 0.342857 118
6 CRISPROFF 0.235080 0.312883 118
3 CRISPOR 0.227962 0.362832 118
5 CRISPRitz_mismatch 0.195054 0.306931 118
0 Cas-OFFinder 0.174777 0.322581 118
1 CCTop 0.163414 0.326761 118
8 GuideScan2 0.061821 0.156098 118
7 FlashFry 0.009670 0.091954 118

The stored summary already contains the global average precision value for each tool. The remaining steps add guide bootstrap intervals and prepare the plotted tables.

Bootstrap helper functions

Code
DISCRETE_TOOLS = {'Cas-OFFinder', 'GuideScan2', 'CCTop', 'FlashFry', 'CRISPRitz_mismatch'}

def normalize_truth_status(value):
    if pd.isna(value):
        return 'unknown'
    if isinstance(value, (bool, np.bool_)):
        return 'true' if bool(value) else 'false'
    text = str(value).strip().lower()
    if text in {'true', 'off'}:
        return 'true'
    if text in {'false', 'on'}:
        return 'false'
    return 'unknown'


def average_precision_from_ranked_rows(rows: pd.DataFrame, n_true_sites: int) -> float:
    if n_true_sites <= 0:
        return np.nan
    ranked = rows.dropna(subset=['rank']).sort_values(['rank', 'match_key']).reset_index(drop=True)
    if ranked.empty:
        return 0.0
    is_true = ranked['truth_status'].map(normalize_truth_status).eq('true').to_numpy()
    if not is_true.any():
        return 0.0
    precision = np.cumsum(is_true) / np.arange(1, len(is_true) + 1)
    return float(precision[is_true].sum() / n_true_sites)

normalize_truth_status standardizes the truth labels used in the matched site table. average_precision_from_ranked_rows recalculates average precision from an already ranked set of matched rows.

Prepare matched rows and guide counts

Code
rng = np.random.default_rng(20260421)
matched_long['truth_status'] = matched_long['truth_status'].map(normalize_truth_status)
matched_long['rank'] = pd.to_numeric(matched_long['rank'], errors='coerce')
by_guide['n_truth_true'] = pd.to_numeric(by_guide['n_truth_true'], errors='coerce').fillna(0).astype(int)

The bootstrap operates at guide level. The matched site table therefore needs a numeric rank column and the guide table needs a numeric count of validated true sites.

Bootstrap intervals by tool

Code
ci_rows = []
bootstrap_reps = 250
for _, summary_row in pr_summary.sort_values('tool').iterrows():
    tool = str(summary_row['tool'])
    tool_matched = matched_long[matched_long['tool'].astype(str) == tool].copy()
    tool_guides = by_guide[by_guide['tool'].astype(str) == tool].copy()
    guide_records = tool_guides[['guide_key', 'n_truth_true']].copy()
    guide_records['guide_key'] = guide_records['guide_key'].astype(str)
    guide_records = guide_records[guide_records['n_truth_true'] > 0]
    guide_keys = guide_records['guide_key'].to_numpy()
    truth_by_guide = guide_records.set_index('guide_key')['n_truth_true'].to_dict()
    matched_by_guide = {
        str(guide): sub.copy()
        for guide, sub in tool_matched.groupby(tool_matched['guide_key'].astype(str))
    }

    samples = []
    if len(guide_keys) > 0:
        for _ in range(bootstrap_reps):
            sampled_guides = rng.choice(guide_keys, size=len(guide_keys), replace=True)
            n_true = int(sum(int(truth_by_guide.get(guide, 0)) for guide in sampled_guides))
            sampled_rows = [matched_by_guide[guide] for guide in sampled_guides if guide in matched_by_guide]
            sampled = pd.concat(sampled_rows, ignore_index=True) if sampled_rows else tool_matched.iloc[0:0].copy()
            samples.append(average_precision_from_ranked_rows(sampled, n_true))
    finite = pd.Series(samples, dtype='float64').dropna()
    average_precision = float(pd.to_numeric(pd.Series([summary_row['average_precision']]), errors='coerce').iloc[0])
    ci_rows.append({
        'tool': tool,
        'average_precision': average_precision,
        'ap_ci_low_95': float(np.percentile(finite, 2.5)) if not finite.empty else average_precision,
        'ap_ci_high_95': float(np.percentile(finite, 97.5)) if not finite.empty else average_precision,
    })

pr_auc_ci = pd.DataFrame(ci_rows)
pr_auc_ci.sort_values('average_precision', ascending=False).head(10)
tool average_precision ap_ci_low_95 ap_ci_high_95
9 MOFF 0.311067 0.218205 0.633427
1 CRISOT 0.296917 0.223800 0.555427
4 CRISPRitz_cfd 0.236436 0.129960 0.436818
3 CRISPROFF 0.235080 0.159578 0.499200
2 CRISPOR 0.227962 0.132015 0.429939
5 CRISPRitz_mismatch 0.195054 0.104998 0.397588
6 Cas-OFFinder 0.174777 0.091184 0.404160
0 CCTop 0.163414 0.091637 0.356431
8 GuideScan2 0.061821 0.013338 0.175939
7 FlashFry 0.009670 0.001769 0.043003

Each bootstrap replicate resamples guides, reconstructs the matched rows for that sample, and recalculates average precision. The resulting interval reflects variation across guide composition.

Plot tables

Code
plot_df = pr_curves.copy()
plot_df['score_section'] = plot_df['tool'].astype(str).map(
    lambda tool: 'discrete standard' if tool in DISCRETE_TOOLS else 'continuous standard'
)
pr_auc_df = pr_summary[['tool', 'average_precision']].copy()
pr_auc_df['average_precision'] = pd.to_numeric(pr_auc_df['average_precision'], errors='coerce')
pr_auc_df = pr_auc_df.dropna(subset=['average_precision']).sort_values(
    ['average_precision', 'tool'],
    ascending=[False, True],
).reset_index(drop=True)
pr_auc_df['score_section'] = pr_auc_df['tool'].astype(str).map(
    lambda tool: 'discrete standard' if tool in DISCRETE_TOOLS else 'continuous standard'
)
pr_auc_df = pr_auc_df.merge(pr_auc_ci[['tool', 'ap_ci_low_95', 'ap_ci_high_95']], on='tool', how='left')
pr_auc_df.head()
tool average_precision score_section ap_ci_low_95 ap_ci_high_95
0 MOFF 0.311067 continuous standard 0.218205 0.633427
1 CRISOT 0.296917 continuous standard 0.223800 0.555427
2 CRISPRitz_cfd 0.236436 continuous standard 0.129960 0.436818
3 CRISPROFF 0.235080 continuous standard 0.159578 0.499200
4 CRISPOR 0.227962 continuous standard 0.132015 0.429939

plot_df holds the stored precision recall coordinates. pr_auc_df combines the stored scalar summary with the bootstrap interval.

Figure generation

Code
figure_dir = layout.docs_dir / 'generated_figures'
figure_dir.mkdir(parents=True, exist_ok=True)

sections = ['discrete standard', 'continuous standard']
fig, axes = plt.subplots(2, 2, figsize=(13.5, 8.8), gridspec_kw={'width_ratios': [1.8, 1.0]})

for row_idx, section in enumerate(sections):
    ax = axes[row_idx, 0]
    section_curves = plot_df[plot_df['score_section'] == section]
    for tool, sub in section_curves.groupby('tool', sort=True):
        sub = sub.sort_values(['recall', 'rank'], ascending=[True, True]).reset_index(drop=True)
        ax.plot(sub['recall'], sub['precision'], linewidth=2, label=str(tool))
    ax.set_xlim(-0.02, 1.02)
    ax.set_ylim(-0.02, 1.02)
    ax.set_xlabel('Recall')
    ax.set_ylabel('Precision')
    ax.set_title(f'Precision recall curves: {section.title()} tools')
    ax.grid(alpha=0.2)
    if not section_curves.empty:
        ax.legend(loc='lower left', fontsize=7)

    auc_ax = axes[row_idx, 1]
    section_auc = pr_auc_df[pr_auc_df['score_section'] == section].copy()
    y_positions = np.arange(len(section_auc))
    low = pd.to_numeric(section_auc['ap_ci_low_95'], errors='coerce')
    high = pd.to_numeric(section_auc['ap_ci_high_95'], errors='coerce')
    value = section_auc['average_precision'].astype(float)
    xerr = np.vstack([(value - low).clip(lower=0), (high - value).clip(lower=0)]) if low.notna().all() and high.notna().all() else None
    auc_ax.barh(
        y_positions,
        section_auc['average_precision'],
        xerr=xerr,
        color='#c46a2c' if section == 'continuous standard' else '#2c5f77',
        edgecolor='white',
        linewidth=0.8,
        error_kw={'elinewidth': 1.0, 'capsize': 3, 'capthick': 1.0},
    )
    auc_ax.set_yticks(y_positions)
    auc_ax.set_yticklabels(section_auc['tool'])
    auc_ax.invert_yaxis()
    auc_ax.set_xlim(0.0, 1.0)
    auc_ax.set_xlabel('Average precision')
    auc_ax.set_title(f'Average precision with 95% CI: {section.title()} tools')
    auc_ax.grid(axis='x', alpha=0.2)
    for idx, plotted_value in enumerate(section_auc['average_precision']):
        auc_ax.text(min(float(plotted_value) + 0.015, 0.985), idx, f'{float(plotted_value):.2f}', va='center', fontsize=7)

fig.suptitle('Figure 3. Precision recall curves with average precision comparison')
fig.tight_layout(rect=[0, 0, 1, 0.96])
out_path = figure_dir / 'figure_3_precision_recall_curves.png'
fig.savefig(out_path, dpi=300)
plt.close(fig)

display(Image(filename=str(out_path)))